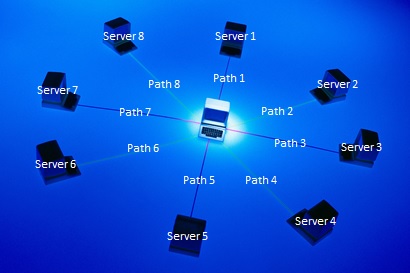
The path latencies are stochastic, as are the server latencies. In this simulation, all latencies are assumed to have a uniform distribution and be independent.
Second, select the maximum latency (between 5 and 100 in increments of 5), also using the "More" and "Less" selectors. This is a conceptual quantity, but can be thought of as either milliseconds in a WAN or microseconds in a LAN/SAN or relative percent. For a network- or I/O-bound task, the quantity would be notably higher for network than for server, for a server- or CPU-bound task the quantity would be notably higher for server than for network. In the simplest case, the two are relatively equal and the default value of 100 for both will suffice.
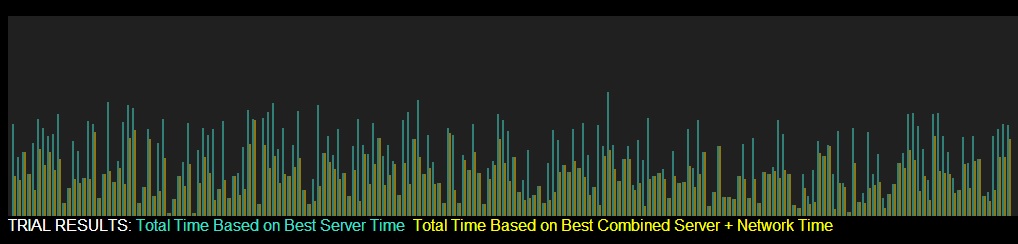
Third, run one or more trials, using the "Run Trials" buttons. The relative results are plotted at the top of the screen, and the statistics are shown on the bottom left. The plot on top refreshes after every 300 trials due to space constraints.
Assuming that both path and server latencies are set to a max of 100 (and a minimum of 0), a few observations may be made.
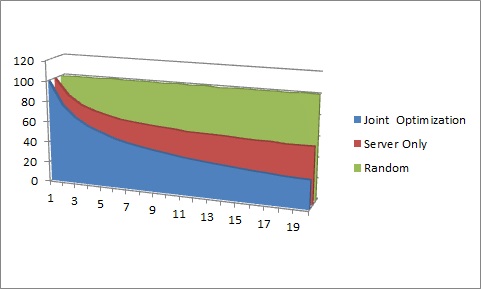
Random Selection: a randomly selected combination has an expected latency value of 100, since the expected value of the randomly selected uniformly distributed path latency is 50 and the expected value of the randomly selected uniformly distributed server latency is 50.
Server-Based Selection: basing the decision solely on the server is better than a random selection. However, in the limit, no matter how many path/server combinations are provided, the expected value of the total latency will never get better than the expected value of the randomly selected path latency, i.e., 50. Increasing the number of uniformly distributed server options reduces the expected value of the server latency to zero as the number of options approaches infinity. Specifically, the expected value of the server latency is 100*(1/(m+1)), where m is the number of options, based on the fact that the order statistics of the kth order (in this case, minimum is where k=1) sample value of m uniformly distributed values follows a Beta distribution with parameters alpha=k=1 and beta=m whose expected value simply reduces to 1/(m+1).
Joint Selection: Occasionally, the lowest joint latency will be from a combination that includes the server with the lowest latency, but that is not generally the case. When the server latency is uniformly distributed from 0 to 100 and the path latency is uniformly distributed from 0 to 100 the joint latency follows a symmetric triangular distribution on the interval from 0 to 200. While the order statistics are more complex, it is clear that E(min(x1, x2, ...xn)) where x1=s1+p1 approaches 0 as n approaches infinity.